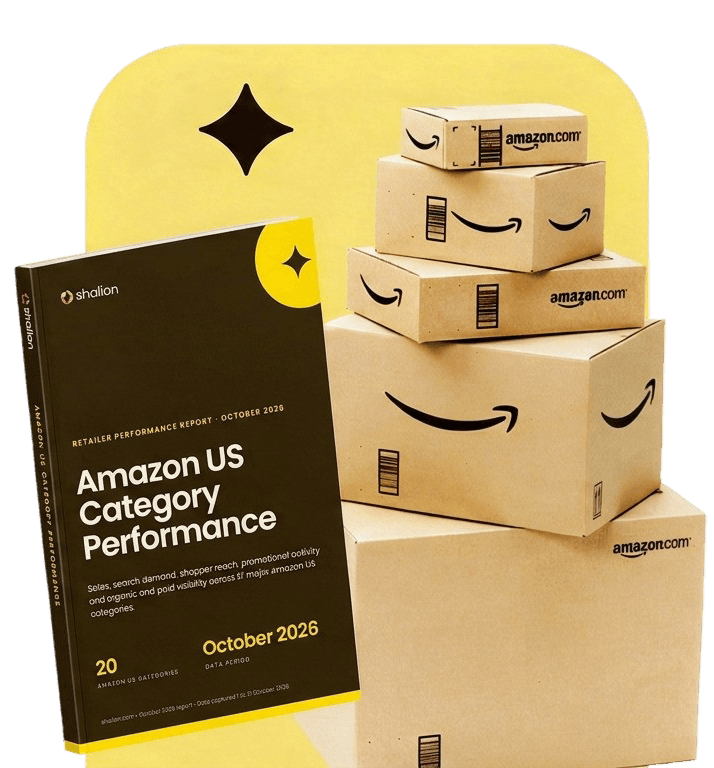
NEW RELEASE · RETAILER PERFORMANCE REPORT
Amazon Category Performance
Sales, search demand, promotional activity and organic and paid visibility across 20 Amazon US categories, with month on month change on every figure. October 2026.
| Rising fastest | Oct vs Sep | Easing | Oct vs Sep |
|---|---|---|---|
| Toys and Games | +28% | Appliances | −3% |
| Musical Instruments | +24% | Office Products | −2% |
| Video Games | +23% |
18 of the 20 categories tracked grew their search demand in October.
Paid rose almost everywhere, organic did not.
Paid impressions were up in 19 of the 20 categories, between 22% and 71%, while organic impressions fell in 15 of them. October carried roughly 30% more sponsored placements per keyword, with total impressions per keyword close to flat.
The shelf did not get bigger, it got more sponsored.
The Q4 build-up is already visible.
Toys and Games led every category at +28%, with LEGO climbing 2.9 points to 3.46% of estimated units. In Video Games, eight of the ten highest-impression keywords were new this month and almost all are console hardware: ps5, nintendo switch 2, xbox series x, ps5 pro.
October reads as Halloween.
"fog machine" was the highest-impression keyword in Musical Instruments, "halloween decorations" in Patio, Lawn and Garden, and "halloween candy" in Grocery and Gourmet Food. Three categories, one shopper.
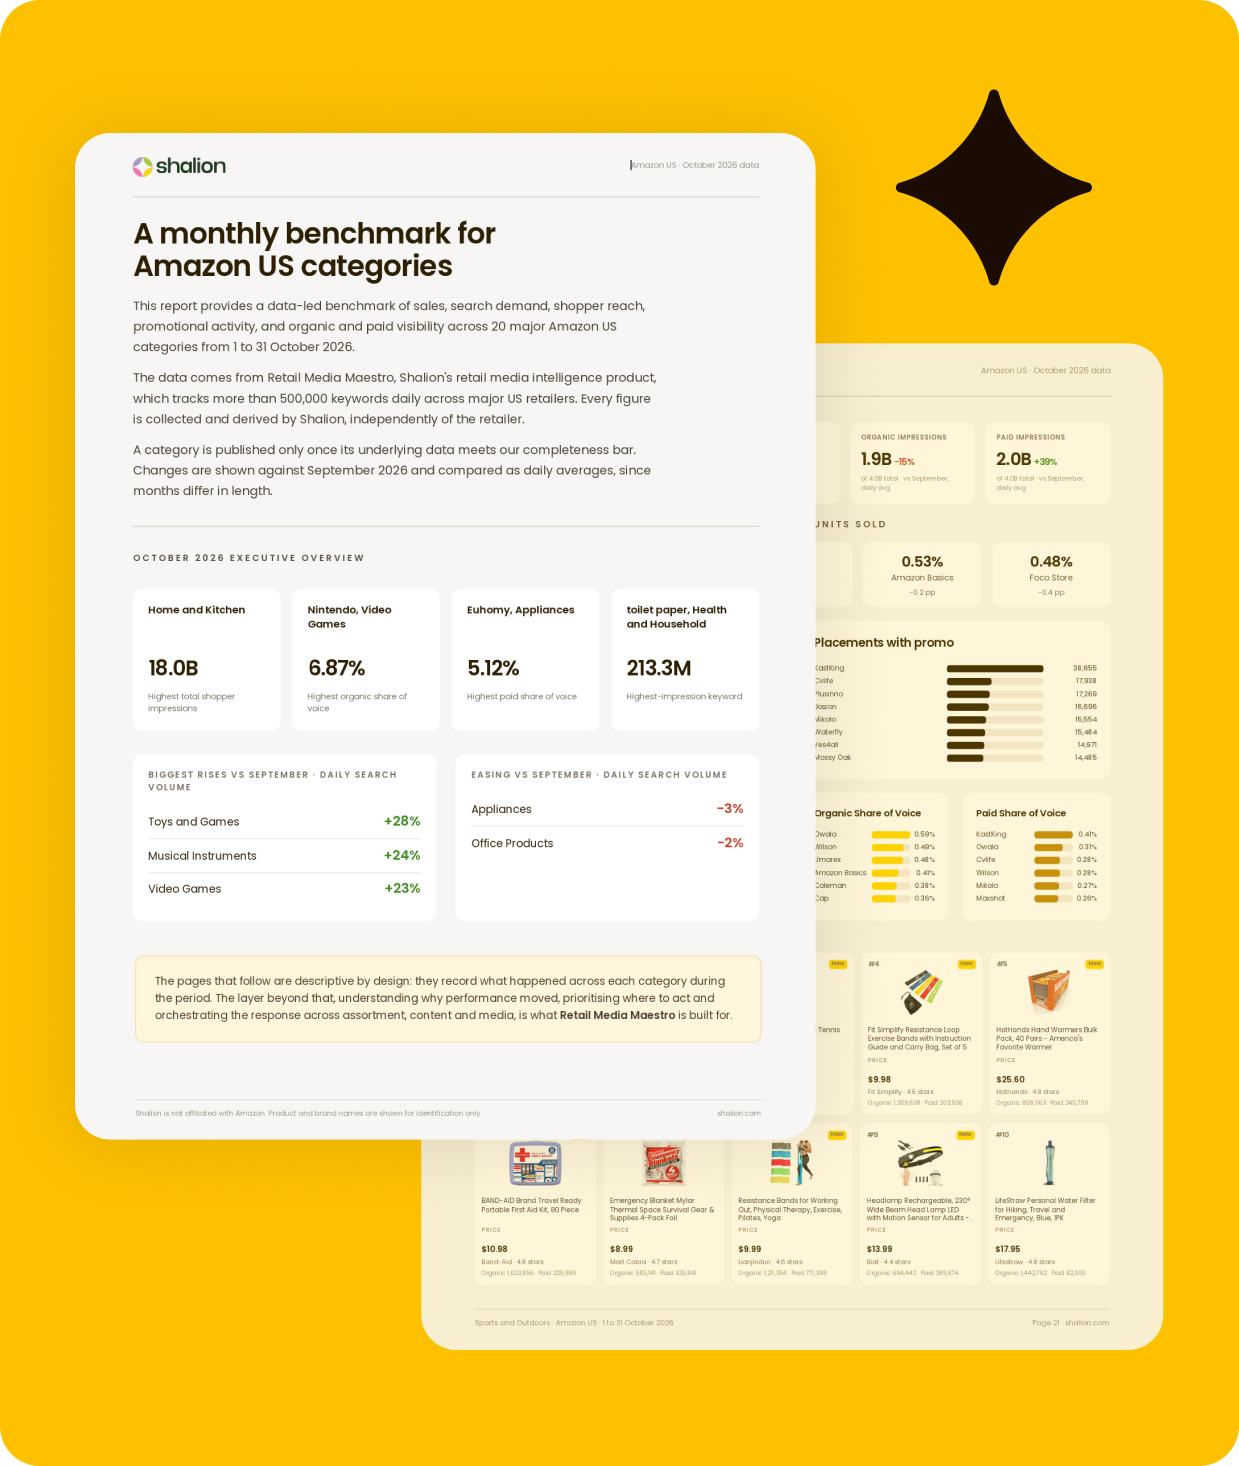
Top brands by category share
Share of estimated units sold in the category for the top five brands, with each brand's change in percentage points against the previous month. Shares are based on units, not sales value.
Top Searched Category Keywords
The keywords from the selected category generating the most shopper impressions, meaning the estimated times that products from the category reached shoppers in search results with their category relevance and the average selling price of the products shown.
Estimated Shopper Impressions
Estimated times category items reached shoppers in search results, split into organic and paid. Shown for the category as a whole and for each top-selling item.
Placements with promo
Deals, coupons, promotional badges and price reductions observed on brand items across the period.
Organic and Paid Share of Voice
Number of placements of the brand over the total number of placements from search results. Shalion calculates this as Weighted Share of Voice, so appearances are weighted by rank, size, above the fold, promotions and video, reflecting real consumer scrolling behaviour. It is reported separately for paid (ads) and organic.
Top-Selling Items
The top products by estimated units sold in the period, with their average price, rating and organic and paid shopper impressions. This report shows the ten highest per category.
Why brands read it
Category share, visibility and promotional activity are measured on the same tracked universe and shown side by side, each with its movement against the previous month, so a brand's position can be read against both the visibility behind it and the direction it is heading.
Every figure is collected and derived by Shalion, with no retailer bias and no holding company conflicts. The same measurement runs daily on Walmart, Target and Kroger.
The report is a benchmark. Diagnosis, prioritisation and recommended actions sit in Shalion Maestro.
AT A GLANCE
Amazon US category performance, October 2026
Search demand, shopper impressions split into organic and paid, leading brand by estimated units share and the highest-impression keyword for each of the 20 Amazon US categories in this edition. Figures cover 1 to 31 October 2026, compared against September as daily averages, and come from Shalion's Retail Media Maestro.
| Category | Search demand | Total shopper impressions | Organic | Paid | Leading brand by category share | Highest-impression keyword |
|---|---|---|---|---|---|---|
| Toys and Games | +28% | 6.1B | 3.4B+10% | 2.7B+71% | LEGO 3.46%+2.9 pp | needoh |
| Musical Instruments | +24% | 467.8M | 225.9M−8% | 241.9M+46% | D'Addario 1.41%−0.2 pp | fog machine |
| Video Games | +23% | 457.1M | 266.9M+16% | 190.1M+35% | Nintendo 4.98%−2.1 pp | ps5 |
| Industrial and Scientific | +22% | 2.6B | 1.3B−5% | 1.3B+41% | Uxcell 0.91%no change | toothpaste |
| Clothing, Shoes & Jewelry | +19% | 2.3B | 1.1B−5% | 1.2B+54% | Adidas 0.80%+0.1 pp | luggage |
| Electronics | +18% | 5.9B | 3.4B+11% | 2.6B+50% | Apple 1.16%no change | laptop |
| Beauty and Personal Care | +17% | 15.7B | 8.6B0% | 7.1B+54% | Medicube 1.94%+0.6 pp | medicube |
| Cell Phones and Accessories | +12% | 1.5B | 867.5M+2% | 659.6M+35% | Anker 3.31%+0.1 pp | iphone 18 pro max case |
| Pet Supplies | +12% | 3.4B | 1.7B−17% | 1.7B+33% | Fancy Feast 2.25%+0.1 pp | cat litter |
| Tools & Home Improvement | +12% | 5.1B | 2.5B−14% | 2.6B+37% | Kohler 1.38%+0.8 pp | shower head |
| Health and Household | +11% | 14.6B | 8.1B−13% | 6.5B+34% | Amazon Basics 4.15%+0.4 pp | toilet paper |
| Automotive | +10% | 1.8B | 921.0M−22% | 910.3M+26% | A-Premium 1.44%+0.1 pp | steering wheel cover |
| Home and Kitchen | +10% | 18.0B | 9.0B−13% | 9.0B+40% | Amazon Basics 1.41%−0.2 pp | owala |
| Sports and Outdoors | +10% | 4.0B | 1.9B−15% | 2.0B+39% | Fanmats 0.66%−0.1 pp | walking pad |
| Patio, Lawn and Garden | +9% | 3.0B | 1.5B−24% | 1.5B+22% | Zevo 1.88%+0.2 pp | halloween decorations |
| Arts, Crafts & Sewing | +8% | 2.1B | 1.0B−20% | 1.1B+31% | Amazon Basics 0.90%no change | sewing machine |
| Grocery and Gourmet Food | +7% | 9.0B | 5.5B−11% | 3.4B+32% | Amazon Grocery 8.75%−0.3 pp | halloween candy |
| Baby Products | +2% | 2.6B | 1.4B−12% | 1.2B+31% | Momcozy 3.14%+0.5 pp | pregnancy pillow |
| Office Products | −2% | 3.1B | 1.6B−40% | 1.5B−1% | Amazon Basics 4.77%−0.9 pp | mouse pad |
| Appliances | −3% | 295.5M | 155.6M−12% | 139.9M+30% | GE 12.04%+3.8 pp | ice maker |
| How to cite this data: Shalion, Amazon US Category Performance, October 2026. Retrieved from shalion.com. | A keyword counts in every category where it holds a placement, so these figures are not mutually exclusive and do not sum to an Amazon US total. |
| Toys and Games | |
|---|---|
| Search demand | +28% |
| Total shopper impressions | 6.1B |
| Organic | 3.4B +10% |
| Paid | 2.7B +71% |
| Leading brand by category share | LEGO 3.46% +2.9 pp |
| Highest-impression keyword | needoh |
| Musical Instruments | |
|---|---|
| Search demand | +24% |
| Total shopper impressions | 467.8M |
| Organic | 225.9M −8% |
| Paid | 241.9M +46% |
| Leading brand by category share | D'Addario 1.41% −0.2 pp |
| Highest-impression keyword | fog machine |
| Video Games | |
|---|---|
| Search demand | +23% |
| Total shopper impressions | 457.1M |
| Organic | 266.9M +16% |
| Paid | 190.1M +35% |
| Leading brand by category share | Nintendo 4.98% −2.1 pp |
| Highest-impression keyword | ps5 |
| Industrial and Scientific | |
|---|---|
| Search demand | +22% |
| Total shopper impressions | 2.6B |
| Organic | 1.3B −5% |
| Paid | 1.3B +41% |
| Leading brand by category share | Uxcell 0.91% no change |
| Highest-impression keyword | toothpaste |
| Clothing, Shoes & Jewelry | |
|---|---|
| Search demand | +19% |
| Total shopper impressions | 2.3B |
| Organic | 1.1B −5% |
| Paid | 1.2B +54% |
| Leading brand by category share | Adidas 0.80% +0.1 pp |
| Highest-impression keyword | luggage |
| Electronics | |
|---|---|
| Search demand | +18% |
| Total shopper impressions | 5.9B |
| Organic | 3.4B +11% |
| Paid | 2.6B +50% |
| Leading brand by category share | Apple 1.16% no change |
| Highest-impression keyword | laptop |
| Beauty and Personal Care | |
|---|---|
| Search demand | +17% |
| Total shopper impressions | 15.7B |
| Organic | 8.6B 0% |
| Paid | 7.1B +54% |
| Leading brand by category share | Medicube 1.94% +0.6 pp |
| Highest-impression keyword | medicube |
| Cell Phones and Accessories | |
|---|---|
| Search demand | +12% |
| Total shopper impressions | 1.5B |
| Organic | 867.5M +2% |
| Paid | 659.6M +35% |
| Leading brand by category share | Anker 3.31% +0.1 pp |
| Highest-impression keyword | iphone 18 pro max case |
| Pet Supplies | |
|---|---|
| Search demand | +12% |
| Total shopper impressions | 3.4B |
| Organic | 1.7B −17% |
| Paid | 1.7B +33% |
| Leading brand by category share | Fancy Feast 2.25% +0.1 pp |
| Highest-impression keyword | cat litter |
| Tools & Home Improvement | |
|---|---|
| Search demand | +12% |
| Total shopper impressions | 5.1B |
| Organic | 2.5B −14% |
| Paid | 2.6B +37% |
| Leading brand by category share | Kohler 1.38% +0.8 pp |
| Highest-impression keyword | shower head |
| Health and Household | |
|---|---|
| Search demand | +11% |
| Total shopper impressions | 14.6B |
| Organic | 8.1B −13% |
| Paid | 6.5B +34% |
| Leading brand by category share | Amazon Basics 4.15% +0.4 pp |
| Highest-impression keyword | toilet paper |
| Automotive | |
|---|---|
| Search demand | +10% |
| Total shopper impressions | 1.8B |
| Organic | 921.0M −22% |
| Paid | 910.3M +26% |
| Leading brand by category share | A-Premium 1.44% +0.1 pp |
| Highest-impression keyword | steering wheel cover |
| Home and Kitchen | |
|---|---|
| Search demand | +10% |
| Total shopper impressions | 18.0B |
| Organic | 9.0B −13% |
| Paid | 9.0B +40% |
| Leading brand by category share | Amazon Basics 1.41% −0.2 pp |
| Highest-impression keyword | owala |
| Sports and Outdoors | |
|---|---|
| Search demand | +10% |
| Total shopper impressions | 4.0B |
| Organic | 1.9B −15% |
| Paid | 2.0B +39% |
| Leading brand by category share | Fanmats 0.66% −0.1 pp |
| Highest-impression keyword | walking pad |
| Patio, Lawn and Garden | |
|---|---|
| Search demand | +9% |
| Total shopper impressions | 3.0B |
| Organic | 1.5B −24% |
| Paid | 1.5B +22% |
| Leading brand by category share | Zevo 1.88% +0.2 pp |
| Highest-impression keyword | halloween decorations |
| Arts, Crafts & Sewing | |
|---|---|
| Search demand | +8% |
| Total shopper impressions | 2.1B |
| Organic | 1.0B −20% |
| Paid | 1.1B +31% |
| Leading brand by category share | Amazon Basics 0.90% no change |
| Highest-impression keyword | sewing machine |
| Grocery and Gourmet Food | |
|---|---|
| Search demand | +7% |
| Total shopper impressions | 9.0B |
| Organic | 5.5B −11% |
| Paid | 3.4B +32% |
| Leading brand by category share | Amazon Grocery 8.75% −0.3 pp |
| Highest-impression keyword | halloween candy |
| Baby Products | |
|---|---|
| Search demand | +2% |
| Total shopper impressions | 2.6B |
| Organic | 1.4B −12% |
| Paid | 1.2B +31% |
| Leading brand by category share | Momcozy 3.14% +0.5 pp |
| Highest-impression keyword | pregnancy pillow |
| Office Products | |
|---|---|
| Search demand | −2% |
| Total shopper impressions | 3.1B |
| Organic | 1.6B −40% |
| Paid | 1.5B −1% |
| Leading brand by category share | Amazon Basics 4.77% −0.9 pp |
| Highest-impression keyword | mouse pad |
| Appliances | |
|---|---|
| Search demand | −3% |
| Total shopper impressions | 295.5M |
| Organic | 155.6M −12% |
| Paid | 139.9M +30% |
| Leading brand by category share | GE 12.04% +3.8 pp |
| Highest-impression keyword | ice maker |
*How to cite this data: Shalion, Amazon US Category Performance, October 2026. Retrieved from shalion.com.
A keyword counts in every category where it holds a placement, so these figures are not mutually exclusive and do not sum to an Amazon US total.
Not seeing your category?
Tell us which one you need and we will include it in the next edition.
Amazon Grocery held the largest share of estimated units of any brand tracked, at 8.75% of Grocery and Gourmet Food. Shares are based on units, not sales value.
Home and Kitchen recorded the highest total shopper impressions of the 20 Amazon US categories covered, at 18.0 billion, followed by Beauty and Personal Care at 15.7 billion and Health and Household at 14.6 billion.
Whole Foods Market recorded 486,589 placements with promo in Grocery and Gourmet Food, the highest of any brand in any category in this edition.
Weighted Share of Voice is the number of placements a brand holds over the total number of placements in search results, with each appearance weighted by rank, size, whether it sits above the fold, promotions and video. The weighting reflects how shoppers actually scroll, so a top placement counts for more than one buried further down. Shalion reports it separately for organic and paid.
Every figure is collected and derived by Shalion through Retail Media Maestro, which tracks more than 500,000 keywords daily across major US retailers. The data is not sourced from Amazon or from a retailer panel, and Shalion has no affiliation with Amazon.
A new edition publishes each month, covering the previous full calendar month, with every figure compared against the month before it.
Toys and Games recorded the largest rise in search demand of the 20 Amazon US categories Shalion tracks, up 28% against September 2026, followed by Musical Instruments at 24% and Video Games at 23%.
Search demand rose in 18 of the 20 Amazon US categories Shalion tracks. Only Appliances and Office Products eased, by 3% and 2% respectively.
Paid impressions rose in 19 of the 20 categories, between 22% and 71%, while organic impressions fell in 15 of them. October carried around 30% more sponsored placements per keyword with total impressions per keyword close to flat.
Which keywords moved the most shopper impressions, and how closely they map to your category
How organic and paid share of voice was distributed, and which brands gained or lost ground
Which brands recorded the most promotional placements, and which entered the top for the first time
Which categories gained search demand last month, and how the balance between organic and paid visibility shifted

Download the free "Amazon Category Performance" report
(20 categories, one page each, October 2026 data)
WHO READS THIS
In Agencies
Account directors
Retail media managers
Insights analysts
New business leads
In Brands
Amazon channel managers
eCom directors
Category leads
Insights and analytics leads
ABOUT THE AUTHOR
Albert Turbina | Chief Innovation Officer
I lead a software development team, driving innovation and ensuring excellence in every solution.

→ The ten highest-impression keywords in every category, with category relevance and average selling price
→ Organic and paid share of voice reported separately, never merged into a single number
→ Placements with promo by brand, from the 525,403 recorded by Whole Foods Market in Grocery and Gourmet Food down to the long tail
→ The ten top-selling items per category, with price, rating and brand
→ Full methodology: what is estimated, what is observed, and what is excluded